Power distribution utilities rely on tariffs to generate revenue, cover expenses, and fund network expansion. While this business model appears sound, many distribution companies (discoms) still suffer significant losses.
Power distribution utilities rely on tariffs to generate revenue, cover expenses, and fund network expansion. While this business model appears sound, many distribution companies (discoms) still suffer significant losses.
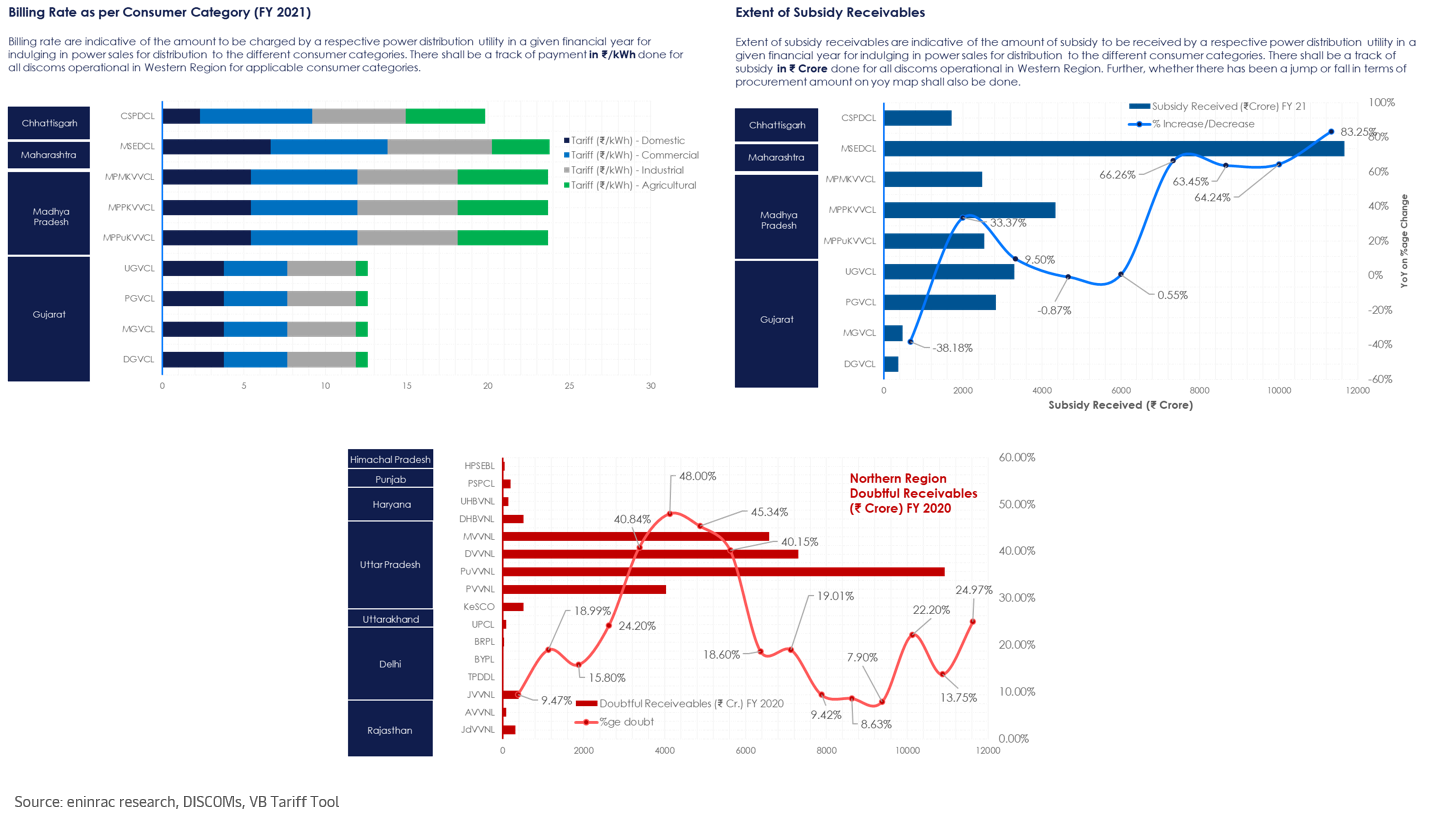
Consumer category wise “Retail Supply Tariffs” in India for FY 2024-25 for Northern Region States
Consumer category wise “Retail Supply Tariffs” in India for FY 2024-25 for Southern Region States
Consumer category wise “Retail Supply Tariffs” in India for FY 2024-25 for Eastern Region States
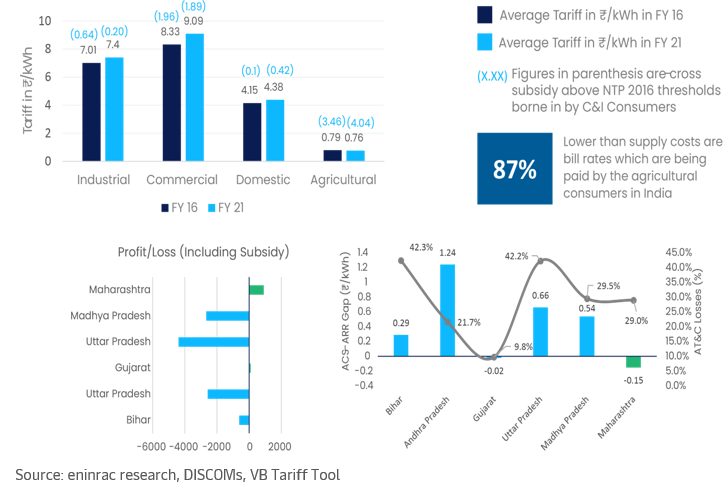
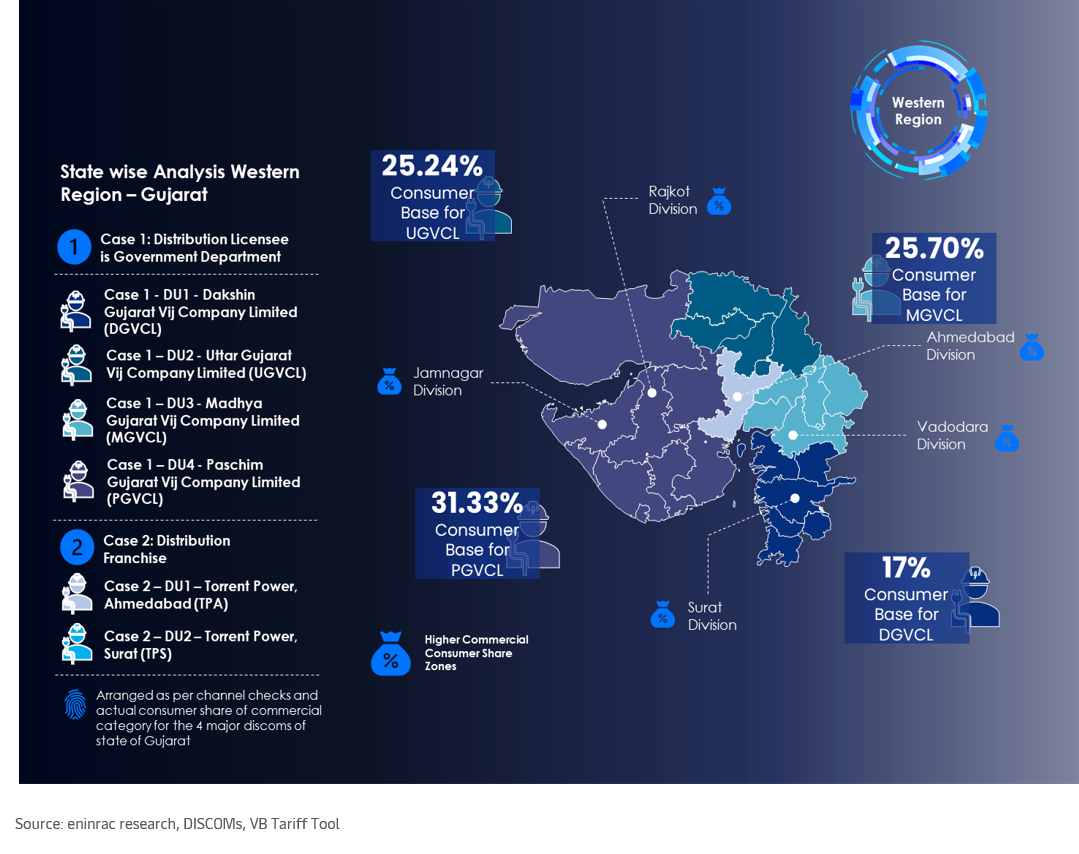
Consumer category wise “Retail Supply Tariffs” in India for FY 2024-25 for Western Region States
Consumer category wise “Retail Supply Tariffs” in India for FY 2024-25 for North Eastern Region States and Union Territories
Interactive Data to Information (D2I) tool for DISCOM wise tariff analysis in India – FY 2024-25
Conclusion, Recommendations & Key Findings
About
Power distribution utilities rely on tariffs to generate revenue, cover expenses, and fund network expansion. While this business model appears sound, many distribution companies (discoms) still suffer significant losses. This raises the question: Where does the system falter? Is it due to discoms prioritizing consumer interests or the authorities' attempts to create politically acceptable policies?
Achieving an unbiased understanding of power distribution is complex, but it is clear that the authorities' intentions can impede the financial stability of discoms. This ongoing issue highlights the need for tariff rationalization as a potential solution. As of April 2024, power distribution tariffs vary significantly across different states in India. For instance, Delhi charges around ₹4-5 per kWh for residential consumers using up to 400 units per month, while states like Maharashtra have higher rates, approximately ₹8-9 per kWh for similar consumption levels. This disparity in tariffs reflects the broader challenges in aligning costs and revenues.
One critical factor is the lack of a mandate for state discoms in India to adjust their supply costs annually. Additionally, net metering payouts are based on the average cost of electricity supply or the cost of supply for only 8-9 of the 29 states. So, why aren't discoms adjusting their tariffs accordingly? The cost of generating electricity has risen, especially for thermal power, due to increased fuel costs and technological advancements aimed at reducing emissions.
USPS
Our Satisfied Patrons and Retention rate of over 98.4% on yoy basis for market reports
Our Market Research DNA & Team of Seasoned Domain Specialists
Key Highlights
Interactive Data to Information (D2I) tool-based analysis for DISCOM wise tariff analysis in India – FY 2024-25
Impact analysis of CERC tariff regulations 2019-24 and way forward
Consumer category wise tariff schedule for FY 2024-25
Consumer category wise revenue contribution for FY 2024-25
Net Aggregate Revenue Requirement for DISCOMs for FY 2024-25
Revenue Gap/Surplus of DISCOMs
Consumer category wise energy sales analysis
Base line data Analysis for DISCOMs
Financial & Operational feasibility/condition of DISCOMs
Report Insights
Power Purchase Cost (PPC) being the greatest contributor to the costs in ARR
Monetary implications arising due to poor planning of transmission network planners
Power tariff structure very complex, needs rationalization
“Latent Power Demand” should be factored by DISCOMs in their power demand forecast
Growing share of Renewable Energy
There is a need to enhance the efficiency of operations at the distribution level
Must Buy For
Power Generating Companies
Power Distribution Utilities
Power Transmission Utilities
Captive/Group Captive Consumers
Independent Power Producers
Commercial & Industrial Consumers
State Electricity Regulatory Authorities
FIIs/Banks
Industrial Park/SEZs/Steel Plants
Power Project Funding Bodies
Foreign Collaborating Agencies
Utility Solar Power Project Developers
Utility Wind Power Project Developers
Other RE Project Developers
Government & Regulatory Bodies
Research Institutions/Bodies
Funding Bodies/Banks
Consulting Agencies
Government Agencies
Investment Institutions
Companies Mentioned
Tata Power Delhi Distribution Limited
BSES Rajdhani
BSES Yamuna
Torent Power
Andhra Pradesh Southern Power Distribution Company
Andhra Pradesh Eastern Power Distribution Compnay
Paschim Gujarat Vij Company Limited
Uttar Gujarat Vij Company Limited
Madhya Gujarat Vij Company Limited
Dakshin Gujarat Vij Company Limited
Madhya Pradesh Madhya Kshetra Vidyut Viatarn Company Limited
Jaipur Vidyut Vitaran Nigam Limited
Dakshinanchal Vdyut Vitaran Nigam Limited
Kanpur Electricity Supply Company Limited
All Other State & Private Distribution Utilities & Franchises
Complete the form to connect with our sales team and see the Visionboard platform in action. Discover how Eninrac helps your teams eliminate poor market research experiences and drive actionable insights.