Report Summary Find out what’s new opportunity for EPC & value chain players across the globe in developing Global LNG Terminal Infrastructure. Gain insights upon which LNG terminals can be used for hydrogen storage & transmission. Learn all about the country wise upcoming LNG terminal projects that are proposed and under construction globally
Global LNG Terminal Infrastructure Opportunity 2023 – Half Yearly Insights
Share Report
License Type
In addition to single user license
- About
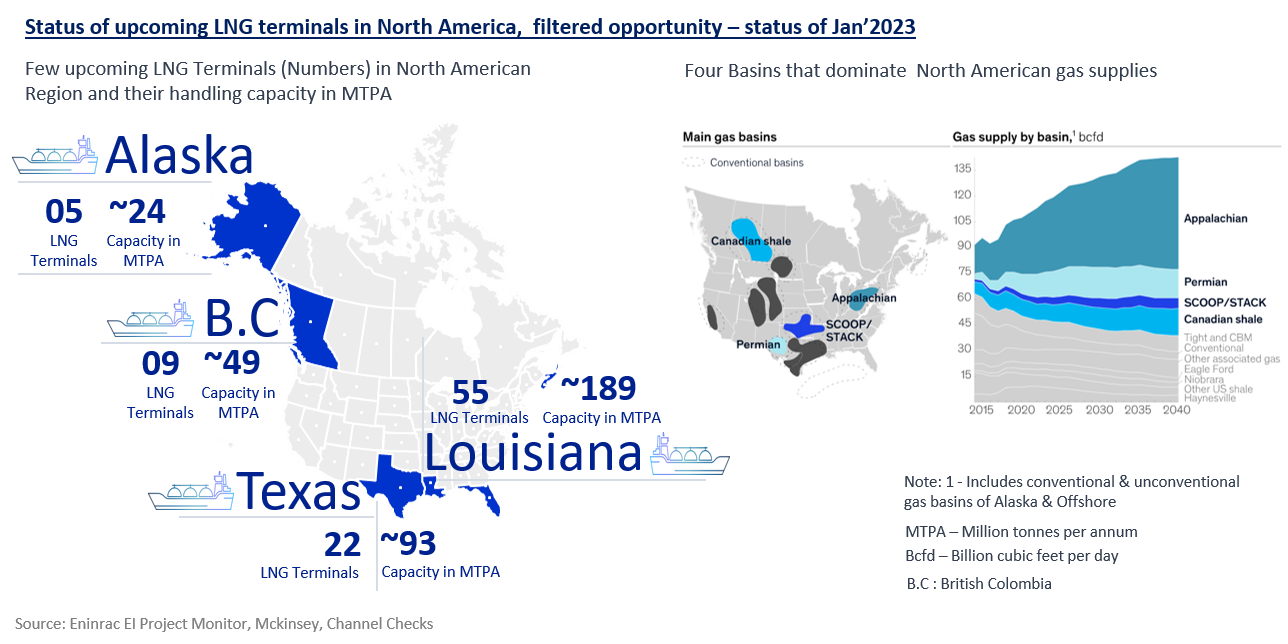
As of Jan 2023, about 480 LNG terminals are operational globally. The cumulative LNG handling capacity of these terminals is more than 1500 MTPA. Globally, Asia-Pacific has largest LNG handling capacity of above 1040 MTPA, with a total of 298 operational LNG terminals . Of this total capacity, about 843 MTPA is the capacity handled by LNG receiving terminals in the region. Europe is the second largest region in the globe via-a-vis LNG terminal infra. Cumulatively, European countries boast a total of 179 MTPA of LNG handling infra capacity, at present, of which 174 MTPA is imported LNG capacity. MENA region is the second largest exporter of LNG globally. Presently, the LNG handling capacity of its export terminals is around 137 MTPA. North America boasts the third largest LNG exports handling infra capacity after Asia-Pacific & MENA region. Presently, in North American region 74 MTPA capacity of LNG export terminals are operational as of Jan’2023.
Gas will be the strongest-growing fossil fuel and will increase by 1 percent from 2020 to 2035. It is the only fossil fuel expected to grow beyond 2030, peaking in 2037. Meanwhile, Global LNG Terminal Infrastructure is set for stronger growth, as domestic supply in key gas markets will not keep up with demand growth. Approximately, 80% growth in the LNG handling infra capacity is anticipated globally by 2030, with total terminal infra capacity reaching a mark of 2700 MTPA. - TOC
- USPs
- Key Highlights
- Report Insights
- Must Buy For
- Companies Mentioned
Get your report flyer
Download the flyer to learn more about:
- Report structure
- Select definitions
- Scope of research
- Companies included
- Additional data points


